Researchers are geolocating America's hidden data centers
The buildout is quieter than the spend. A small group of analysts is mapping what the hyperscalers have not disclosed.

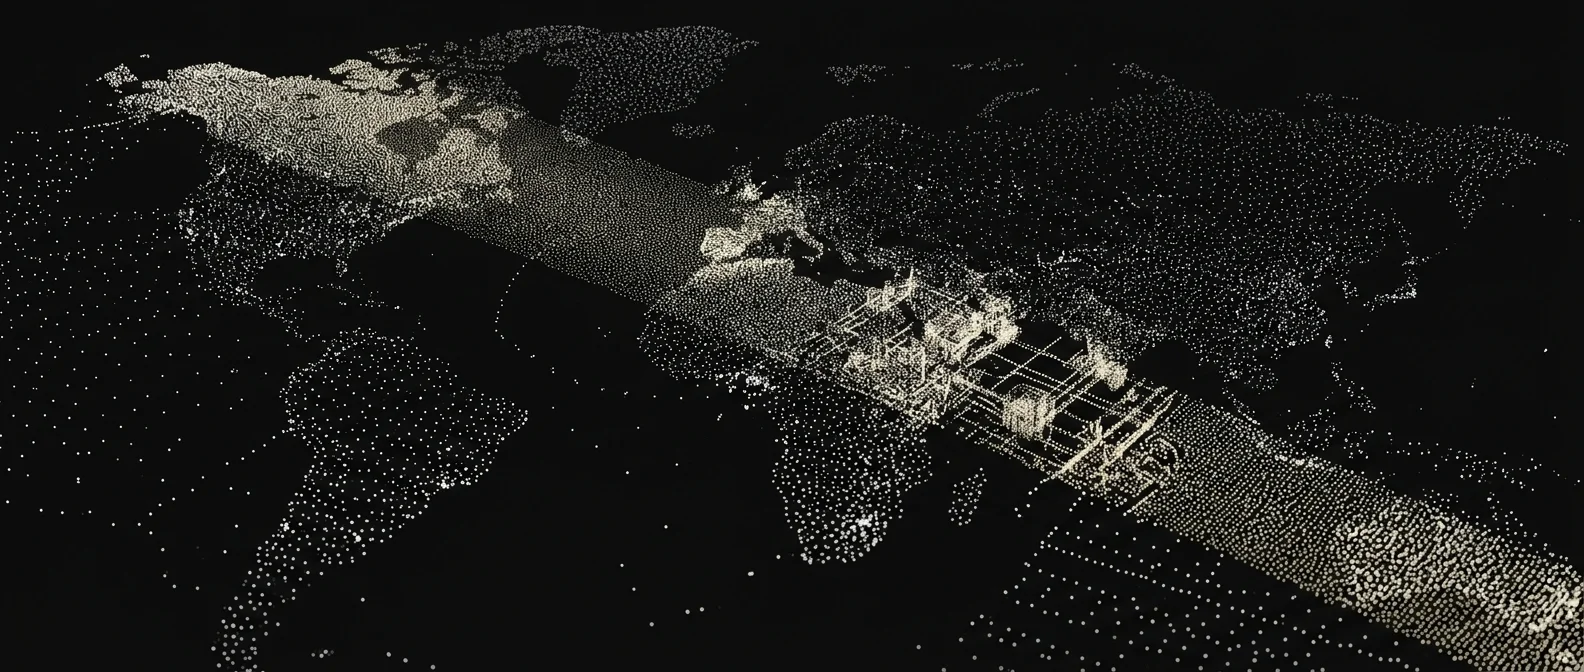
Epoch AI and its peers are stitching together satellite imagery, FAA filings, and power-company records to ground-truth capital-expenditure numbers the industry prefers vague. The map grows weekly, and the gap between disclosed and observed capacity has, by the researchers' own tallies, widened rather than closed over the last two quarters.
The hyperscalersMassive cloud computing providers that operate data centers at a global scale, predominantly Amazon Web Services, Microsoft Azure, and Google Cloud. Their infrastructure forms the physical backbone of the modern internet and artificial intelligence.' public capexCapital expenditure. The money a company spends to buy, maintain, or improve fixed physical assets, such as servers, land, and data center facilities. figures are not wrong. They are, rather, incomplete in a specific and load-bearing way: they aggregate across regions and quarters in forms that obscure where the steel is actually rising. Analysts, investors, and grid operators have all been working from the same partial picture. What the new mapping projects offer is the other half — the geolocated, building-by-building ledger that turns a line item into a zoning question.
The methodology, according to researchers at Epoch and a small number of academic collaborators, combines high-cadence commercial satellite imagery with FAA construction notices, utility interconnection queuesThe waiting lists of energy projects and large-scale power consumers applying to connect to the regional electrical grid. Grid operators use these queues to evaluate whether the existing transmission infrastructure can handle the new load., and county-level permit filings. A data centre of appreciable scale is, it turns out, difficult to hide from any single one of those sources, and impossible to hide from all four. The resulting database has, by the researchers' own count, already identified several dozen previously undisclosed facilities across Virginia, Arizona, and the Columbia River basin.
The winners are the local reporters, utility commissioners, and community groups for whom a verifiable map is leverage — the first time the buildout's local footprint has been legible to anyone other than the builders themselves. The losers are the hyperscalersMassive cloud computing providers that operate data centers at a global scale, predominantly Amazon Web Services, Microsoft Azure, and Google Cloud. Their infrastructure forms the physical backbone of the modern internet and artificial intelligence.' investor-relations teams, whose ability to manage the narrative around power draw, water consumption, and construction timelines now contends with a public ledger they do not control.
What the project opens is a model for civic-scale infrastructure accountability in an industry that has, until now, negotiated its footprint in private. What it forecloses is the assumption that because the compute buildout is abstract at the level of earnings calls, it must also be abstract on the ground. It is not abstract on the ground. It is concrete, sited, and increasingly mapped.